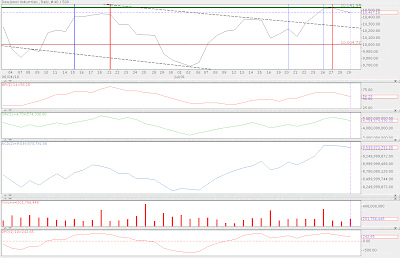
A very tight range trade of two days from the 26th July 2010 to the 27th July 2010 after breaking out of it's volatility spread on the 22nd July 2010. This break out from 10300 was mainly to do with q2 earnings. The Dow is now topped at 10541 with a sell pressure on, note all volume indicators to volume show divergences, indicating that liquidity is not pouring into the Dow and stocks. Also evident of bigger funds/investment banks chasing higher yields for the end of July 2010 consolidation. This can be seen with USD weakness and high yield currencies buys (potentially a bad bet but nevertheless a short term mega buy, especially if China's PMI release in early August 2010 is weak, US GDP figures are weak, and Japanese retail investors cutting long position on carry trade currencies; a major sell on high risk/yield assets will ensure).
The Dow should fall back into it's volatile based trading ranges, with further selling pressure in the next 5 mths the 10000 breach should not be ruled out as all major indices have topped out for the half year major selling activity will continue; especially when yields remain weak on the 10yr and 2yr Treasury's and should fall lower effecting stock gains.
H2 could see risk aversion remain as the sell factor.
Green (26th July 2010) and Red (27th July 2010) horizontal lines
Note massive divergence between Volume and OBV and ACD (horizontal dotted line)

No comments:
Post a Comment